What's Burndown chart and its benefits?
- 原创
- 2017-10-29 14:34:17
- zhangjiahui
- 2463
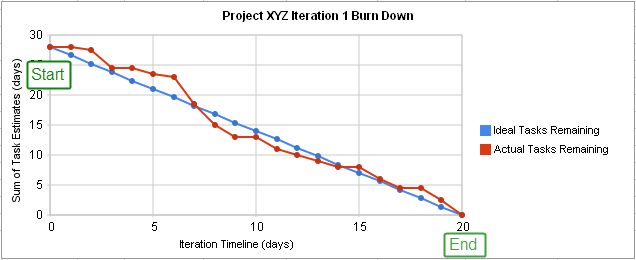
A burn down chart is a graphical representation of work left to do versus time. The outstanding work (or backlog) is often on the vertical axis, with time along the horizontal. That is, it is a run chart of outstanding work. It is useful for predicting when all of the work will be completed. It is often used in agile software development methodologies such as Scrum. However, burn down charts can be applied to any project containing measurable progress over time. Outstanding work can be represented in terms of either time or story points. [From Wikipedia, the free encyclopedia]

Burndown Chart Highlights
The best feature of Burndown charts is that it is used to visualize when the work in a sprint is scheduled to be completed, and whether teams are on track to finish it in time. Many project managers are willing to run these charts and share them with their team
daily .
With burndown chart tools, managers and team members can:
1. Schedule automatic chart creation (reviewing charts daily is recommended).
2. Visualize q
uickly progress and performance.
3. Use search function to recall previous data when planning future sprints
Benefits of Burndown Charts
To some extend, burndown charts can forces teams to constantly evaluate their performance
daily and prioritize again work as needed, which helps maintain the accuracy of sprint and project backlogs as well as the Scrum board. Besides, project managers save time by using software to automatically run charts, rather than creating them manually.
What's more, team members also save time by tracking progress visually, instead of sorting through email, tasks and documents for status updates and project managers can plan more effectively, especially when teams have to add or drop members, by consulting chart data from previous sprints. You can get a good experience in project management software with Burndown chart. Visit the website:
www.zentao.pm.


